- Home
- Sponsors
- Population Statistics
- Diabetes and Obesity
Diabetes and Obesity
1. Diabetes
Counties Manukau has the highest rates of diabetes in the country (Figure 1) possibly due to the ethnic mix that chooses to live there (Figure 2) and the associated economic deprivation that many suffer from (Figure 3).
Figure 1: Estimated rate of diabetes per 1000 people, by district health board, 2021
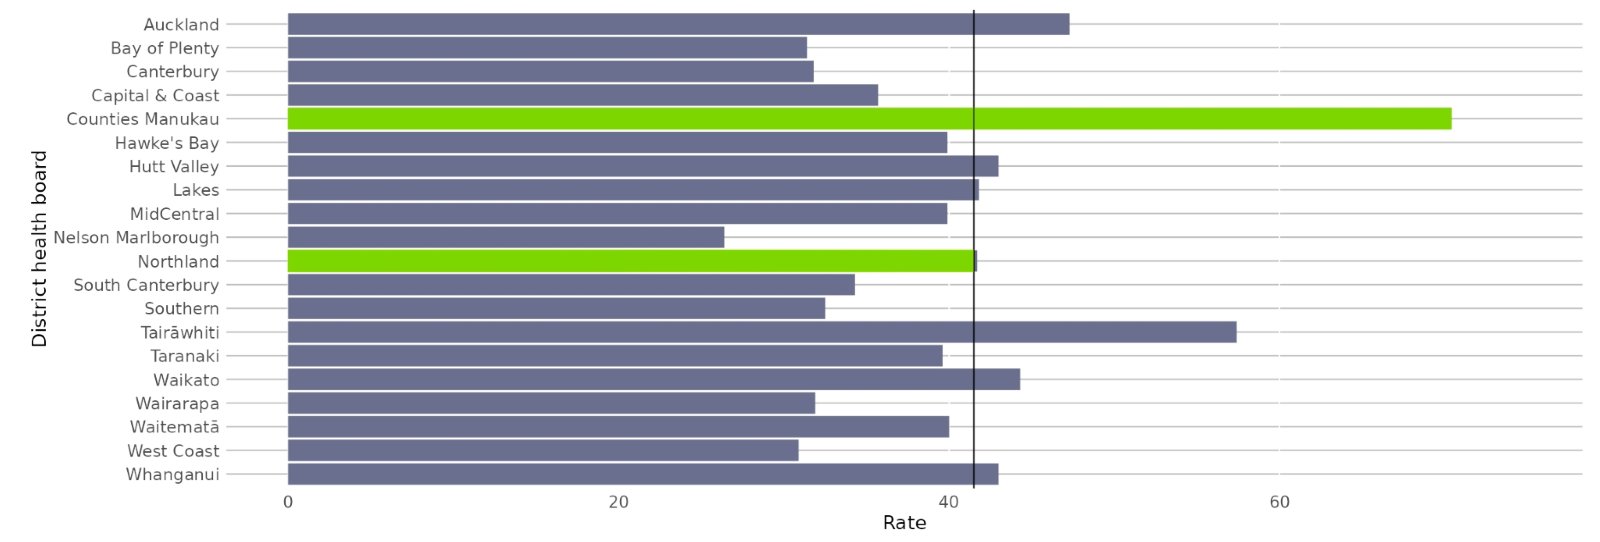
Source: Te Whatu Ora – Health NZ.
Rates are per 100,000 and age-standardised to the World Health Organization's standard world population. The national rate is shown by the black vertical line.
Both the local indigenous people Māori and the Pacifica people who have emigrated from the surrounding Pacific Island (Fiji, Samoa, Tonga and Niue) are over-represented in all disease and chronic illness compared to European (pakeha). This is especially true of diabetes where the immigrant Indian population also suffers very high rates (Figure 2).
Figure 2: Estimated rate of diabetes per 1000 people, by ethnic group, 2021
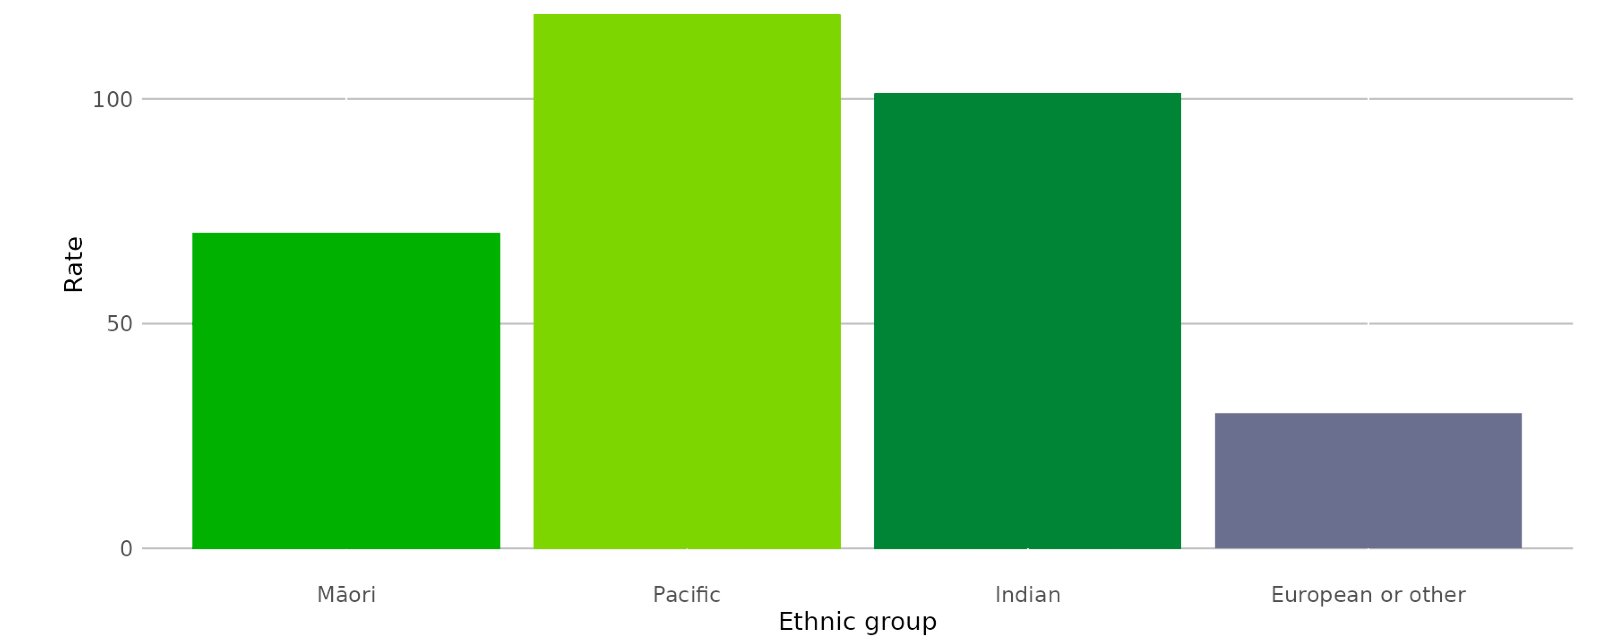
Source: Te Whatu Ora – Health NZ.
Rates are per 100,000 and age-standardised to the World Health Organization's standard world population.
As Figure 3 illustrates the most economically deprived tend to also suffer from the highest rates of diabetes with the poor of Counties Manukau suffering more from diabetes than anywhere else in the country.
Figure 3: Estimated rate of diabetes per 1000 people, by district health board and deprivation quintile, 2021
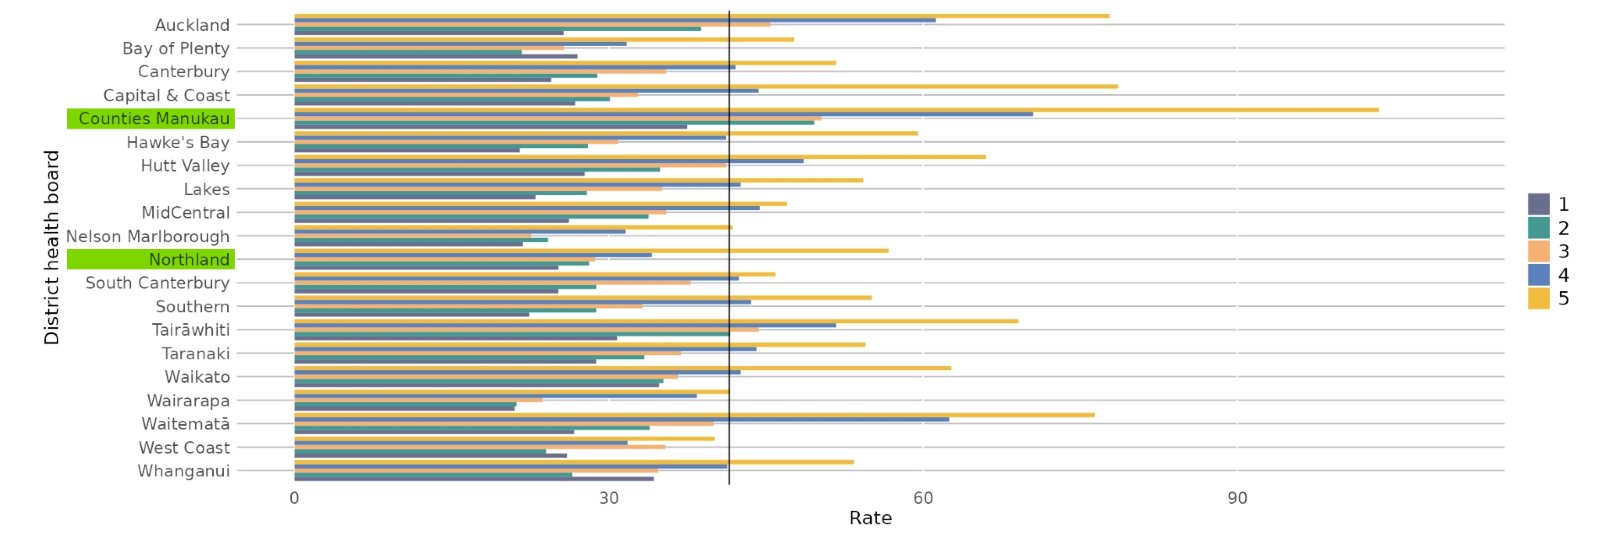
Source: Te Whatu Ora – Health NZ.
Rates are per 100,000 and age-standardised to the World Health Organization's standard world population. The national rate is shown by the black vertical line.
2. Overweight and Obesity
Both Northland and Counties Manukau communities suffer significant rates of adults who are overweight and obese (Figure 4).
Figure 4: Overweight or Obese BMI of 25>0 or greater
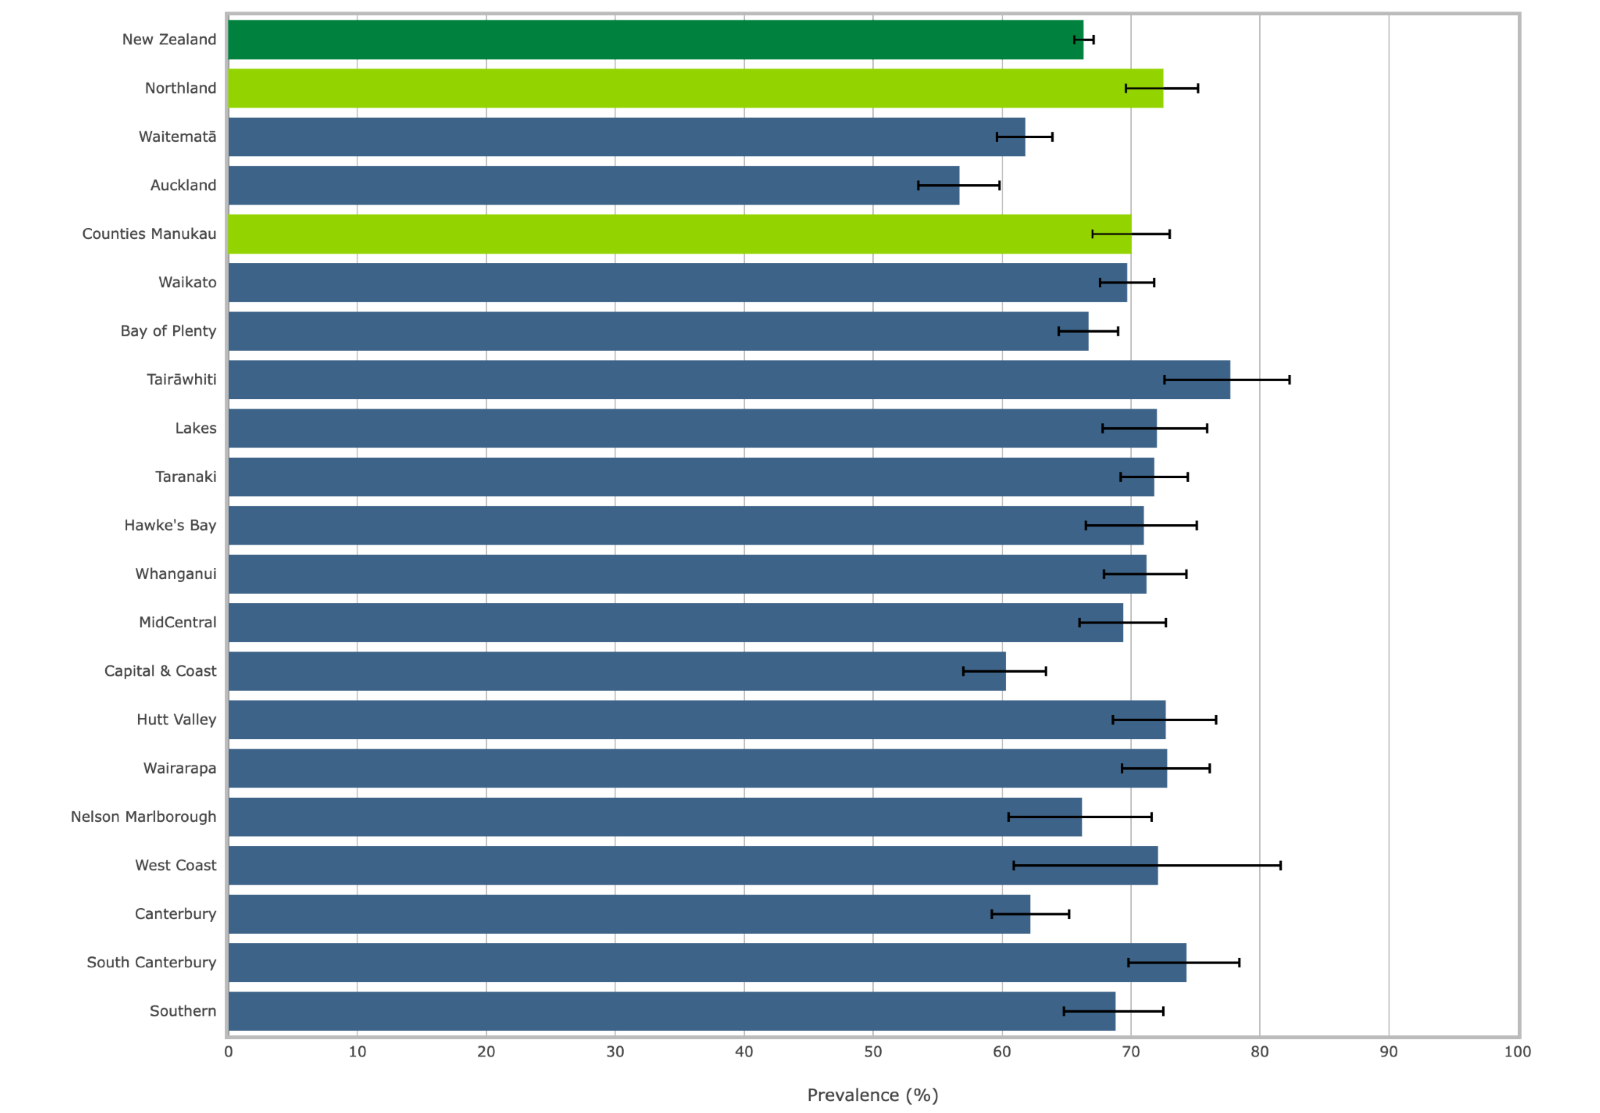
Source: New Zealand Health Survey (2017-2020)
Obesity alone is a significant health concern for both communities as measured by having a BMI of greater than 30 (Figure 5), In Counties Manukau roughly 38% of adults are obese and 37% in the Northland region.
Figure 5: Obese: BMI of 30.0 or greater (or IOTF equivalent for 15-17 years) per Health District 2020
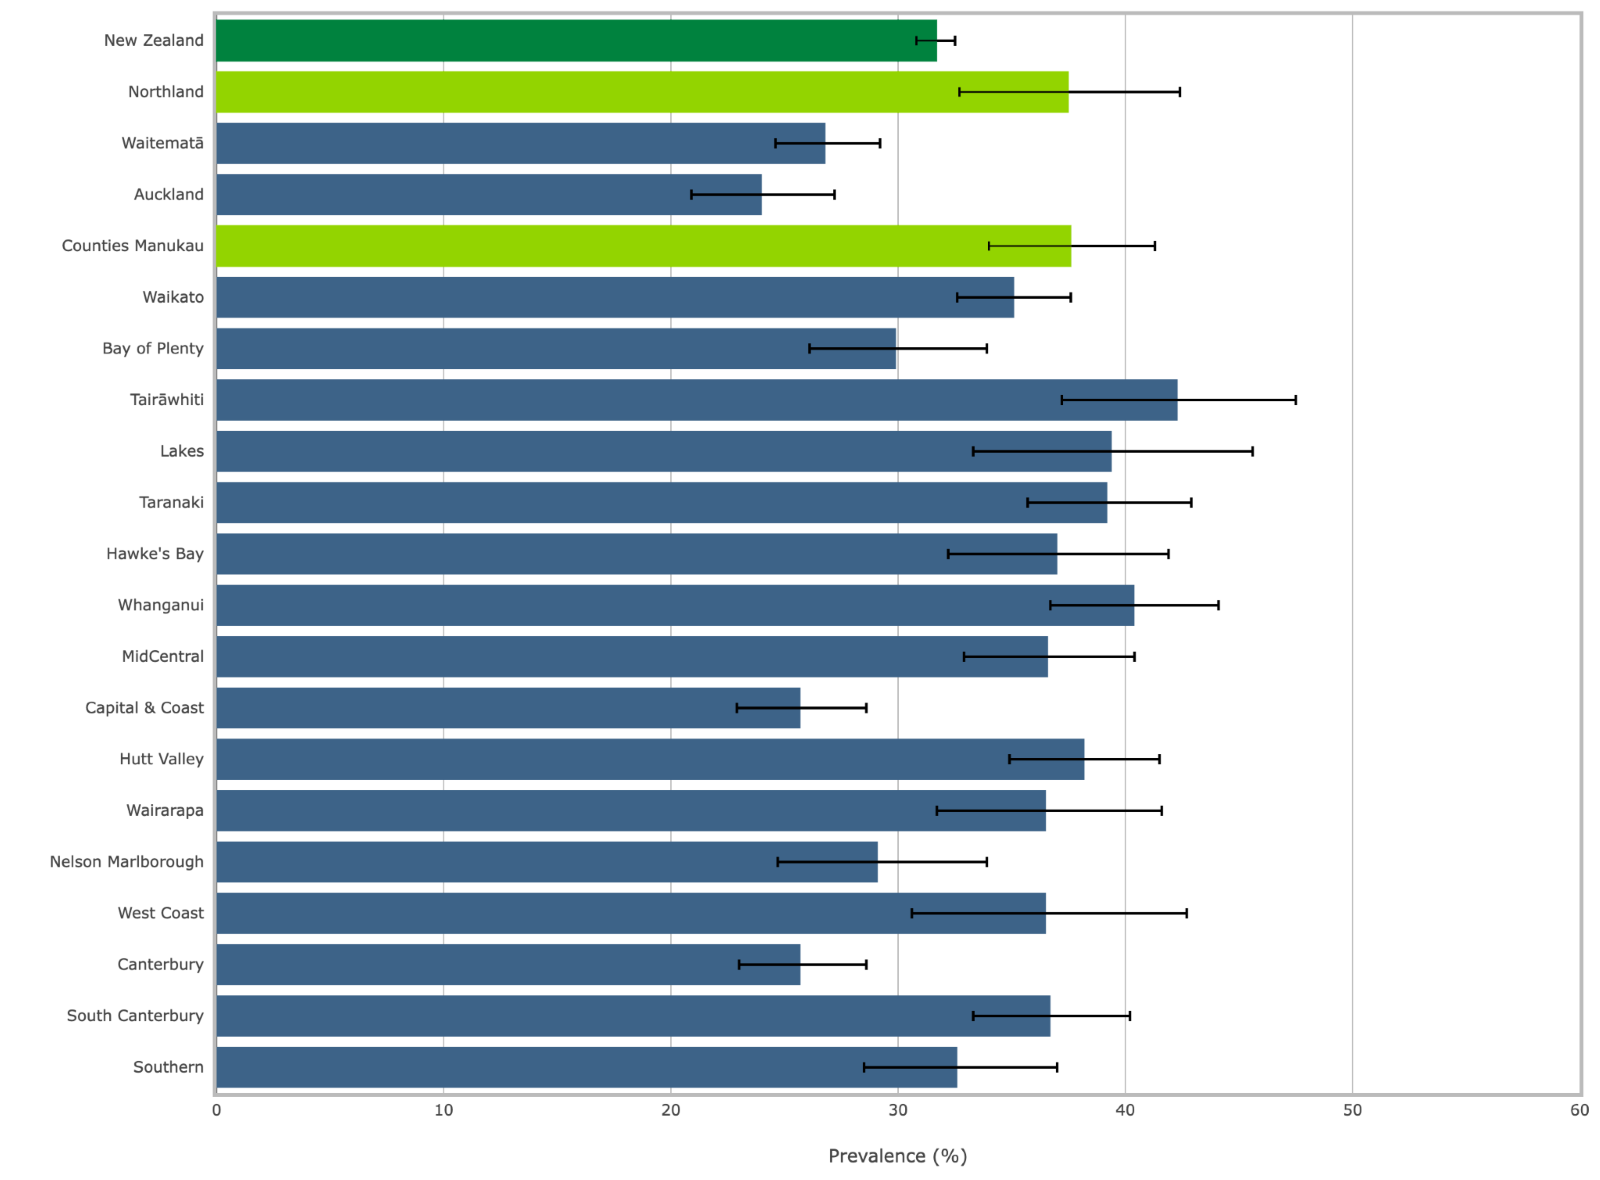
Source: New Zealand Health Survey (2017-2020)
The above graphs and more can be accessed via these two public health links
Te Whatu Ora Diabetes Statistics
New Zealand Health Survey Statistics
A printable version of these statistics is also available:
Diabetes Statistics ( PDF in Documents)